 Basic MS Excel
Excel is an electronic analysis pad that allows the user to enter and work with numbers. The power of a spreadsheet is that projections can be made by changing data to perform what if operations. Another common use for spreadsheets is to visually analyze data by making charts and graphs.
The purpose of this unit is to get you started to use Microsoft Excel. The Unit will attempt to teach you some generic information systems concepts and skills using Excel. Of course, as a side effect, you will learn a great deal about the spreadsheet software called MS Excel. This electronic spreadsheet is faster and more flexible than the traditional methods of numerical calculation and data prediction. Administrators can use a spreadsheet to create time lines, game boards, or graphs and to keep track of budgets, attendance charts, surveys, and checklists. The current lesson will explain the basic operations of spreadsheets and allow the user to make blank charts or tables for general usage. This unit will also discuss the true power of spreadsheet software.
Before we begin, if you haven't done so, spend sometime reviewing the overview videos about Microsoft Word, Excel, Publisher, and PowerPoint. This will help you familiarize yourself with the software interface and how to navigate around. Pay close attention to how you can access and navigate the software features and functionalities.
| Microsoft Office Overview Videos |
Resources
-
Microsoft Excel 2007 Tutorials
[http://www.fgcu.edu/support/office2007/excel/index.asp] from Florida Gulf Coast University - Microsoft Excel 2007 Overview (Document version)
[http://its.psu.edu/training/handouts/excel_overview.pdf] from Pennsylvania State University - Microsoft Excel 2007 Overview (Recorded Training: Required Adobe Connect Plug-in)
[https://breeze.psu.edu/p55384547/] from Pennsylvania State University
Module Activities
To learn how
to use MS Excel for
"Numerical Calculation and Data Projection", you will complete 2 excercises below.
* Keep in mind that the overview videos and class demonstration may not cover every detail of the excercises. In order for one to learn to operate a machinery (car) or software, one must actually use and experience it. In addition to familiarize yourself with the software, the purpose of this module is for you, by yourself or with helps from colloeagues, to try to figure out some (frequently used) features and functions of this software.:
Download the Excercises file HERE - Once downloaded, save it as "EXLEX-1-2_YOURNAME" to your work area folder (of your choice).
Excercise #1: Create a spreadsheet and graph of your own budget:
Now, download and open the Excercises file from above link, and open "Sheet1". Modify existing information for your own budget for the previous year (From January to December). Your file should look like the screen shot of a file below (except you will have all 12 months, Jan. - Dec.)
Important: A complete budget spreadsheet must have:
- 12 months columns
- all totals cells auto calculated by using formula
- a graph / chart that best represents the data
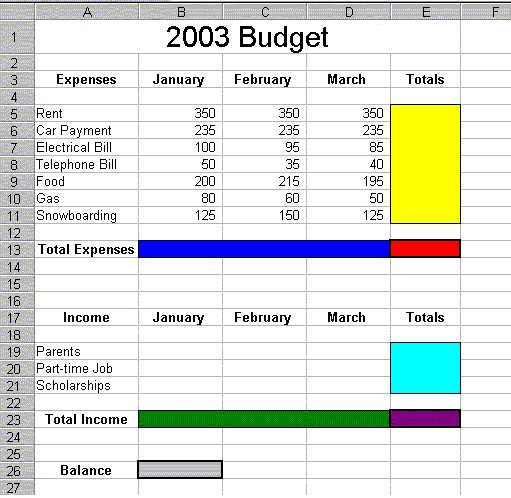
Continue working on your file. Use the following the directions as a guidance. :
- Fill in the formulas to add up the expenses for each month (dark blue area). Fill in the sum for each expense as well (yellow area). You can either use a straight formula, like =(B1+B2+B3) or you can use a function, like =SUM(B1:B3). Hint: If you are going to use a function, your best choice here would be the SUM function. The sum function takes the sum of a specified group of cells.
- Now, fill (right/down) the formulas to add up the income for each month as well as the total from each income source (green and light blue areas). If you used the straight formula for the last step, use the function this time. And, if you used the function last time, use the straight formula this time.
- Now finish off the calculations and subtract the expenses from the income for each of the 12 months, =E23-E13, or the purple cell minus the red cell. This calculation should be located in cell B26 (grey cell).
- After you have everything filled in and calculated, insert at least ONE graph / chart that represents your budget spreadsheet.
- When working on the documents for long period of time, it's STRONGLY recommended that you save your file periodically.
As you can see, there may not be only one way to achieve a desired result. The one great thing about computers is that you can do things more than once. Use it to your benefit. If you are not sure that you get the right answer, try different way to see if you get the right answer.
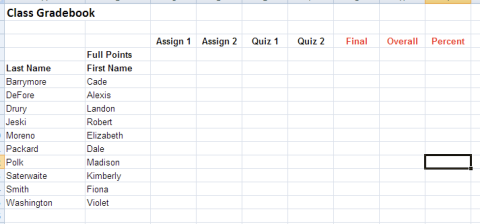
Excercise #2: Create a spreadsheet and graph of your gradebook:
In the same file you used for Excercise #1, open "Sheet2". Modify a spreadsheet of your gradebook to include at least 15 students in your own imaginary class. Your gradebook file should look similar to the figure below.
Important: A complete gradebook spreadsheet must have:
- a minimum of 15 students / records
- a minimum of 6 grading categories (the downloaded file has only 4 categories)
- all Final, Overall, Percent cells auto calculated by using formula
- a graph / chart that best represents the data
Submission
When finished, you should have ONE (1) final file (EXLEX-1-2_YOURNAME). Upload the finished files along with other assignments to the appropriate dropbox (as indicated by your instructor).
Additional Resources:
Interesting Links
More on Using Excel in Class:
- Create a Seating Chart with Excel
- Create a Chart or Graph with Excel
- Create a Grade Book in Excel
- Create a Labeling Worksheet
- Create a Watermark with Excel
- Create an Adlib Story with Excel
- Create an Interactive Map in Excel
- Create Class Surveys with Excel
- Create Self-Correcting Worksheets
- Create Tessellations with Excel
- Excel-ent Activities Across the Grades
- Make A Poster With Excel!
- Teaching Excel
- Timelines in No Time
- Top 10 Excel Questions
- Using Excel to Create Interactive Crossword Puzzles
- Using Spreadsheets to Create Interactive Grade Books